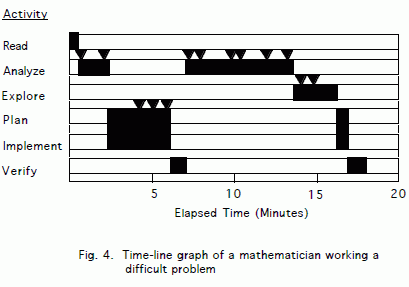
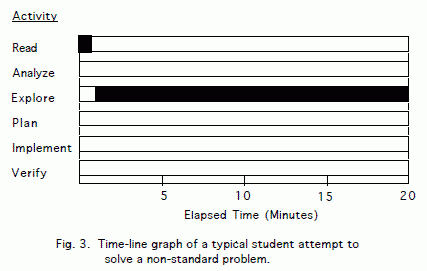
I like these graphs which show how a mathematician and a typical student solve a problem. The first two graphs were from the post “Some research discoveries”. The last one is mine, on teachers time-line graph in doing problem solving.
This is how mathematicians solve problems:

This is how a typical student solves problems:

Here’s my time-line graph of a typical teacher solving a non-standard problem in the class. I asked these teachers how they solve challenging math problems and how long it usually take them to find the solutions. It actually resembles that of the mathematicians. For some reason when they do the problems in their classes they present them like it’s magic, effortless.


Nice post. I think I saw the first two diagrams in a book.
These graphs don’t show an important step of mine, which is to go away for a while. If I can solve a problem in one sitting, I don’t think of it as a difficult problem. I blogged about solving a non-standard problem here. I didn’t give amounts of time, but it looks like most of the time was spent exploring and analyzing, pretty much mixed together.
Yeah, thanks for pointing that out. Going away for awhile when stuck is an important step in solving a problem.